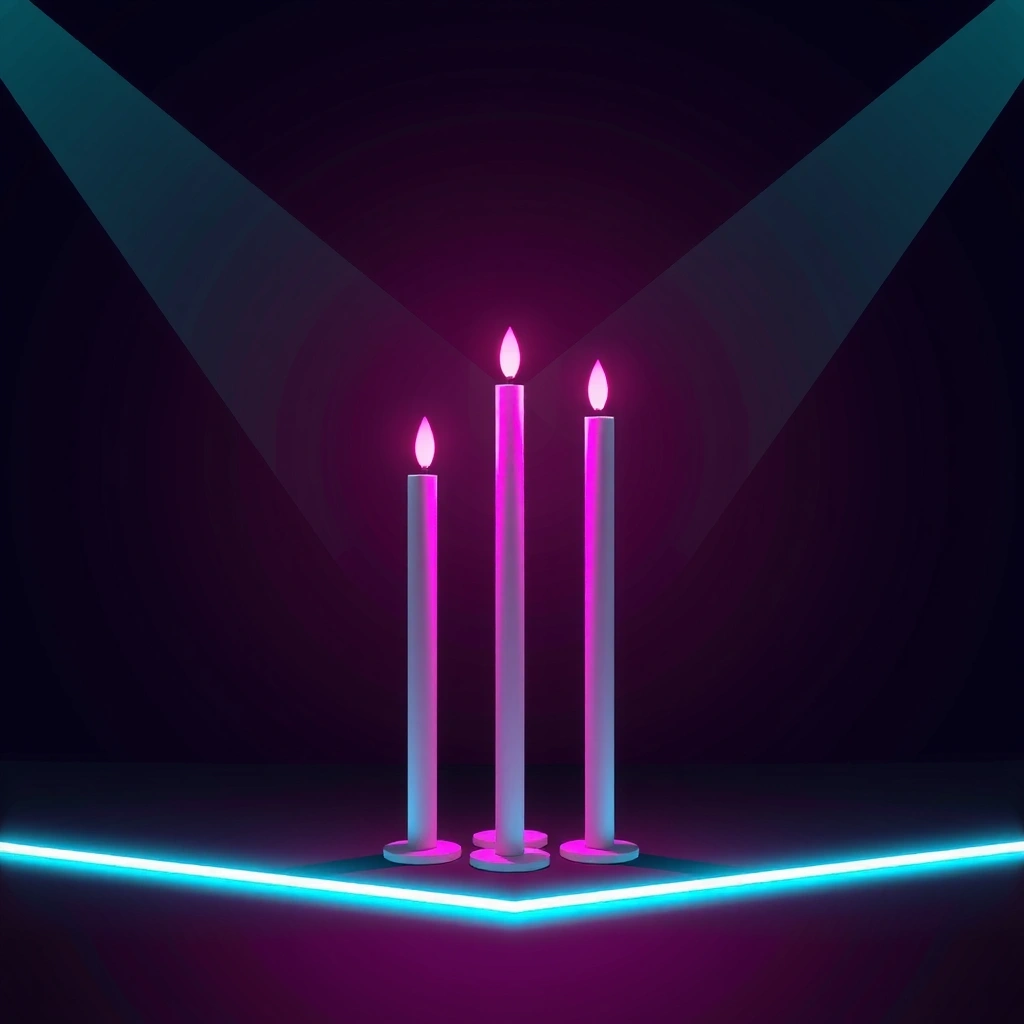
Neon Candles
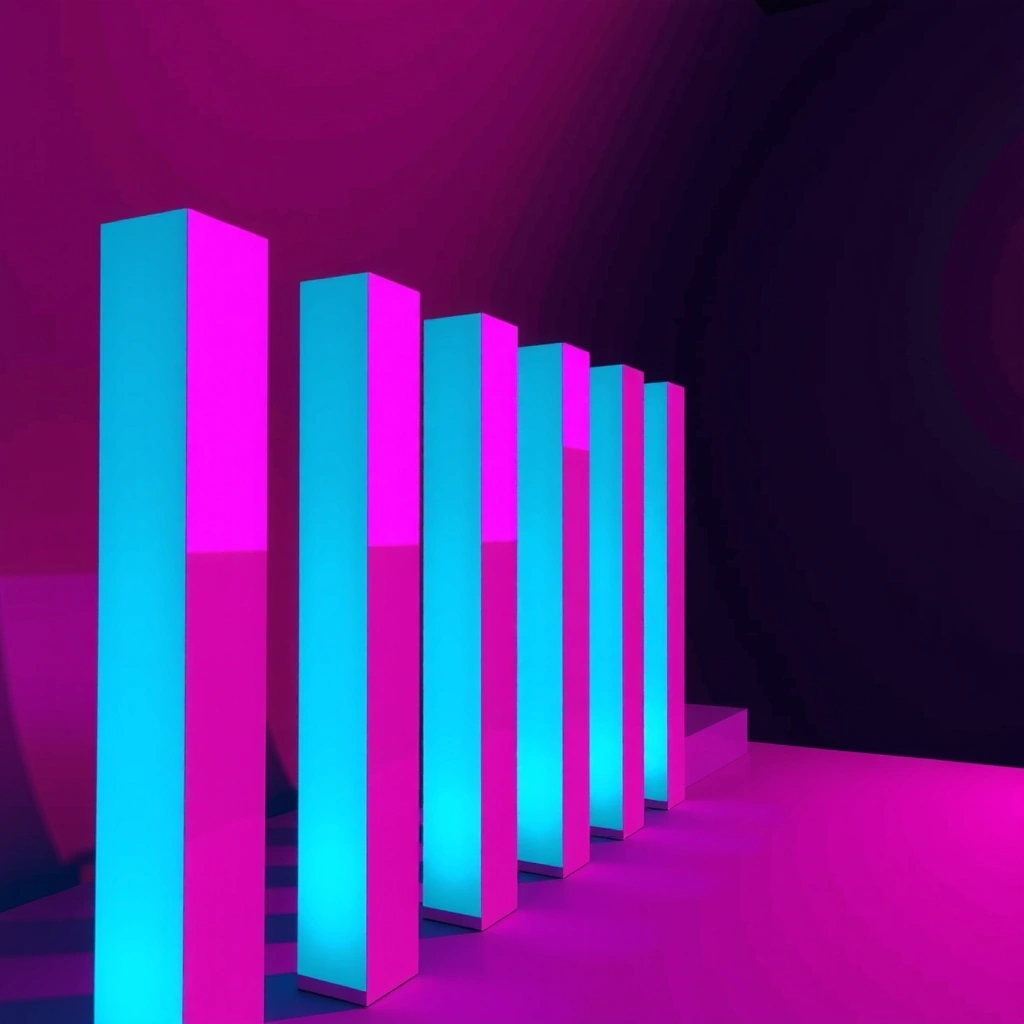
A rhythm-based shooter utilizing 120Hz refresh rate rendering. The visual feedback loop synchronizes enemy spawn rates with neon bar heights.
Exploring the intersection of abstract aesthetics and game mechanics through Huipant's signature 'Candle' and 'Chart' visual language. This portfolio showcases our proprietary rendering techniques and shader experiments designed for the next generation of mobile gaming.
Filter our conceptual library by visual performance tags.
A rhythm-based shooter utilizing 120Hz refresh rate rendering. The visual feedback loop synchronizes enemy spawn rates with neon bar heights.
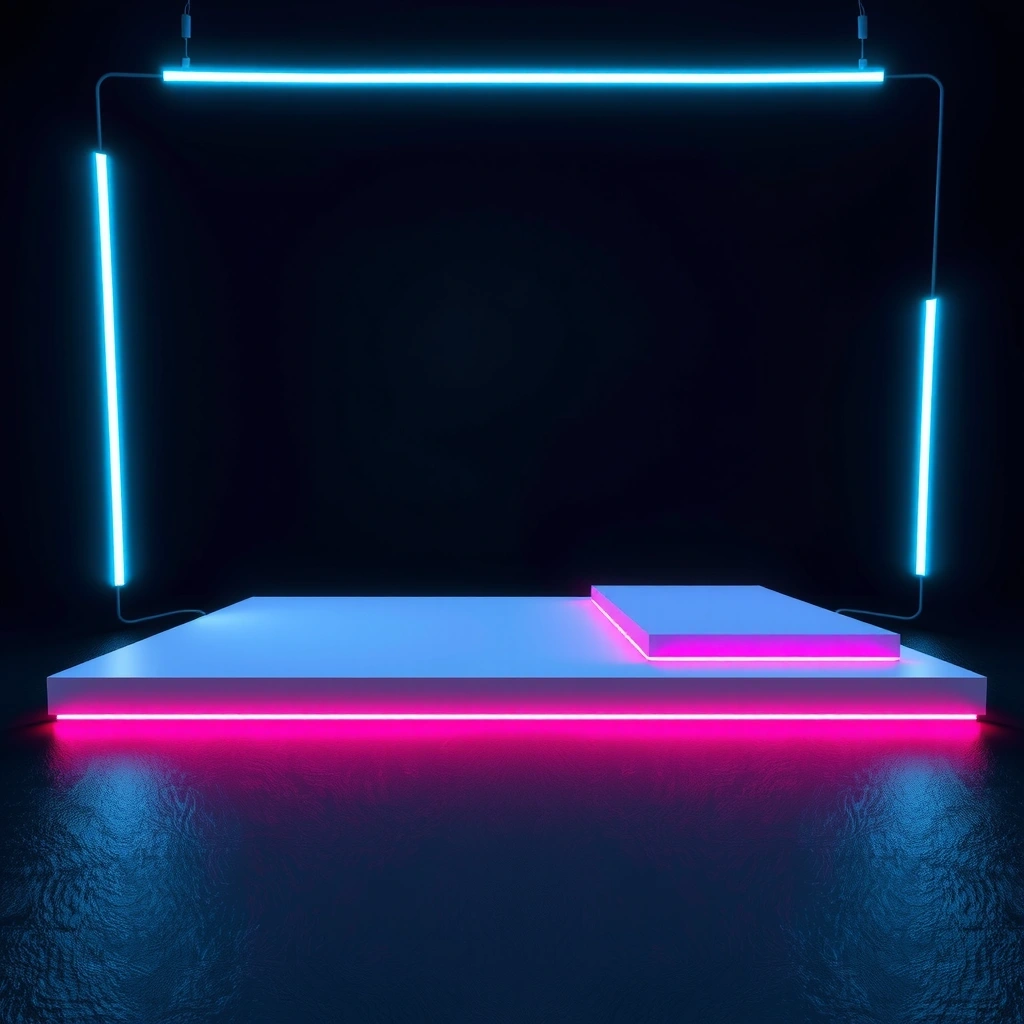
Premium paid-only puzzle game. No ads, no trackers. The core mechanic involves predicting the trajectory of falling 'chart' nodes.
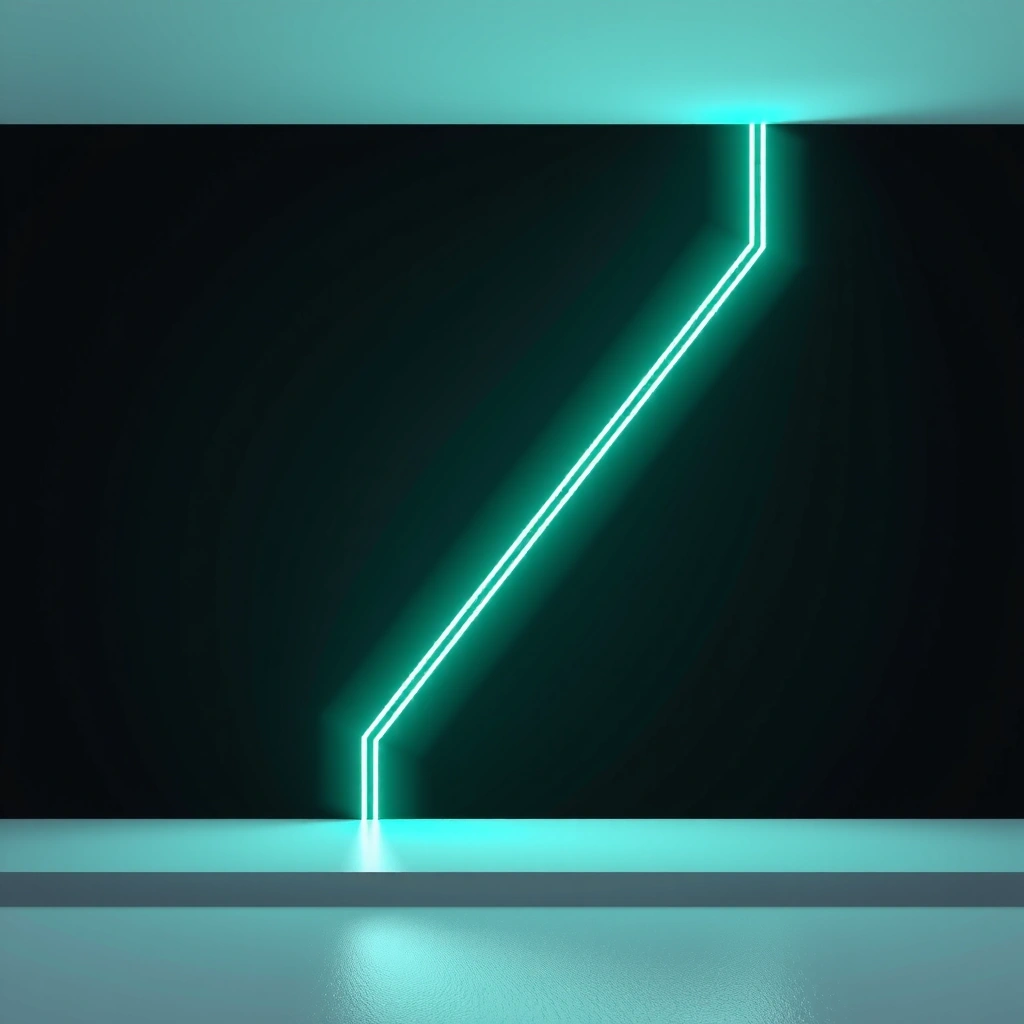
Visualizer engine testbed. We stress-tested the rendering pipeline by generating thousands of concurrent neon lines.
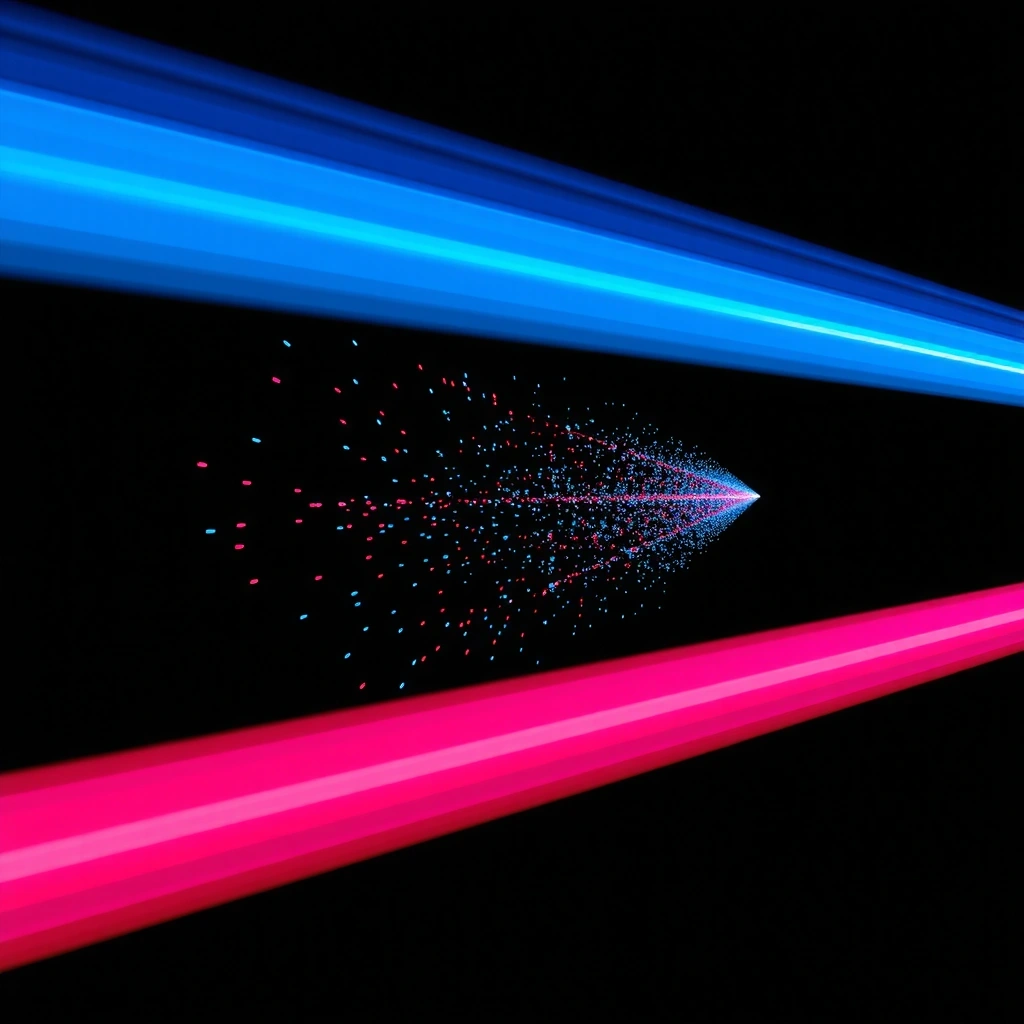
Optimization milestone test. Achieved 90fps stability on mid-range devices using custom Vulkan drivers.

Stock market simulator with gamified risk assessment. Features a candle-to-bar conversion engine for visual feedback.
Diagnostic tool ported to a mini-game. Players maintain 60FPS by balancing shader complexity vs. draw calls.
Hover over the nodes to inspect specific optimization milestones achieved in the Huipant engine.
Achieved 95% thread utilization on 8-core mobile processors. The engine distributes physics calculations across background threads without stutter.
Median frame submission time of 0.8ms. This allows for complex particle effects to run in parallel with the main render pass.
Static memory allocation stays under 45MB for the base scene. Dynamic buffers are recycled efficiently.
Asynchronous texture streaming pipeline. High-res assets load in the background without impacting input latency.
Myth: "This style only works for finance games."
Fact: We've successfully applied it to platformers and shooters. The key is mapping verticality to player agency, not just literal stock data.
Candle: Vertical element denoting state magnitude.
Chart Node: Static reference points on the grid.
Neon Drift: A visual glitch effect used when high-precision rendering is failing.
Establish the target platform (iOS/Android) and FPS goals. We map out the 'Candle' hierarchy: which stats require real-time visualization versus delayed updates.
Select the rendering approach. For 120Hz devices, we use Vulkan. For 60Hz, OpenGL ES is sufficient. Validate assumptions by running a "Chart Stress Test" to see if visual lines remain distinct.
Build the shader pipeline. We map the 'Candle' height to a uniform variable and pass it to the fragment shader. The 'Chart' lines are drawn using instanced rendering for performance.
Review the visual output against the 4.5:1 contrast ratio requirement. Ensure that motion blur does not obscure the chart lines. Document the assets for the internal library.
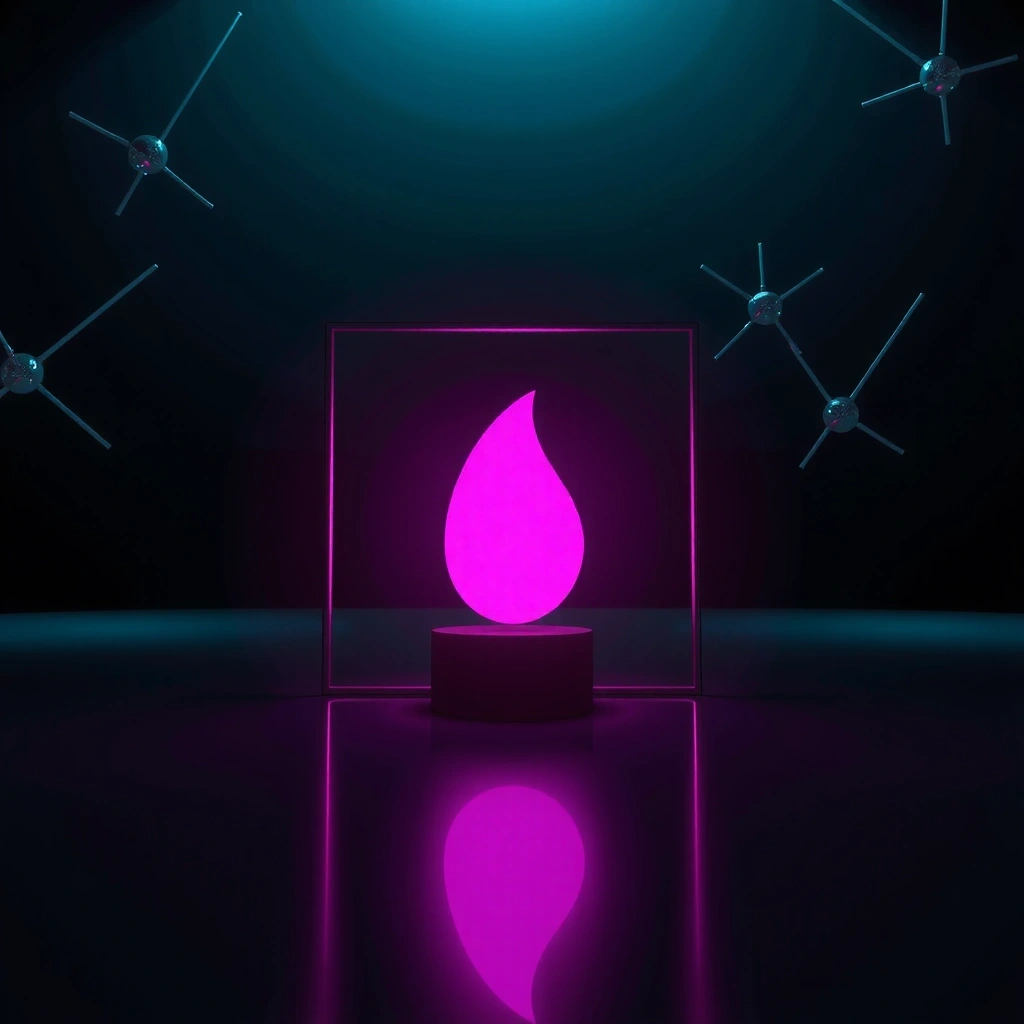
When we started Huipant, the goal was simple: make data beautiful. We didn't want numbers on a screen; we wanted a living, breathing visual language. The 'Candle' concept emerged from late-night coding sessions where the only light came from monitor reflections on the desk. It represents volatility, energy, and the pulse of the game engine.
RENDER.PIPELINE: ACTIVE
Our rendering engine operates entirely on-device. No gameplay data is sent to external servers, ensuring total privacy compliance for European markets.
Scenario: An indie studio used our 'Chart' prototype. Result: 40% reduction in UI asset memory usage compared to standard sprite sheets.